
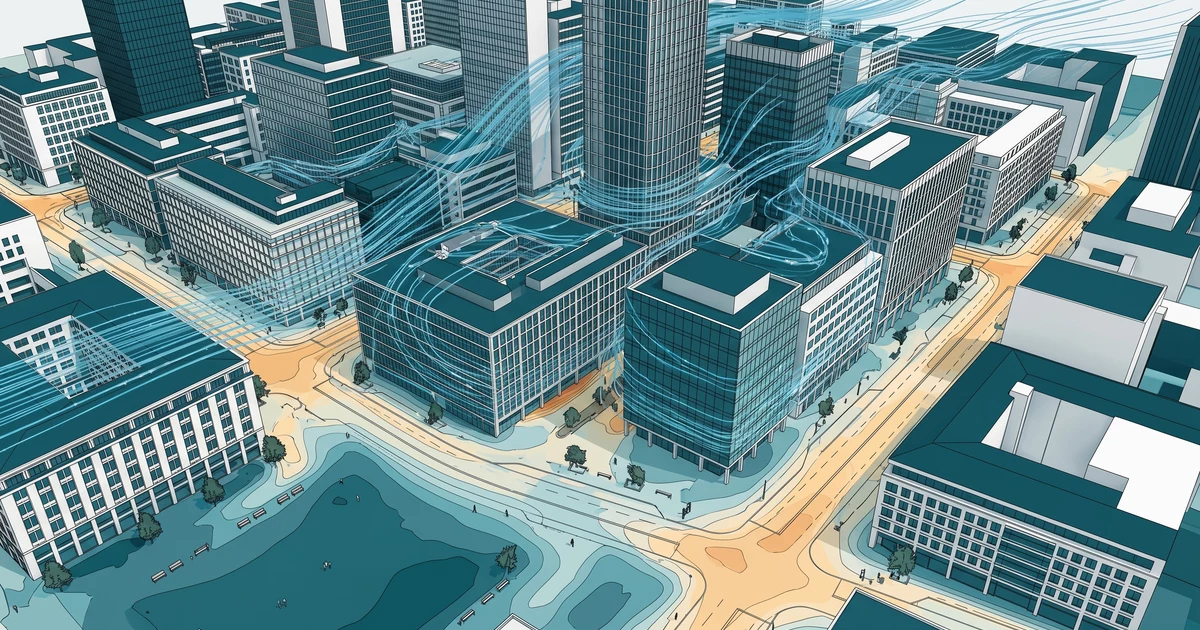
Pedestrian wind comfort is not only a velocity plot. It is a study of how often people experience wind conditions that are suitable for sitting, standing, or walking around a building.
The dicehub Pedestrian Wind Comfort template turns this study into a repeatable CFD workflow. It combines an urban geometry, local weather data, simulations from the important wind directions, and accepted comfort criteria.
This article explains that workflow through our study of the Berliner Bremsenwerk complex in Berlin. The complete summary report and full analysis are public.
Study facts
| Input or result | Value |
|---|---|
| Weather station | Berlin-Tempelhof, DEU_BE_Berlin-Tempelhof.AP.103840_TMYx |
| Distance from the site | 6.44 km |
| Historical wind period | 1938–2007 |
| Long-term mean wind speed | 4.05 m/s at 10 m height |
| CFD wind directions | 16 |
| Pedestrian evaluation height | 2 m above ground |
| Comfort criteria | Lawson and NEN8100 |
| Main result | No mitigation was strictly necessary; trees could improve comfort on the western to southwestern side |
These values come from the published analysis report. They show why a useful wind comfort study needs more than one CFD case.
The engineering question
The Bremsenwerk site includes a large building volume, nearby structures, and an elevated railway. These features change the flow near entrances, corners, passages, and pedestrian areas.
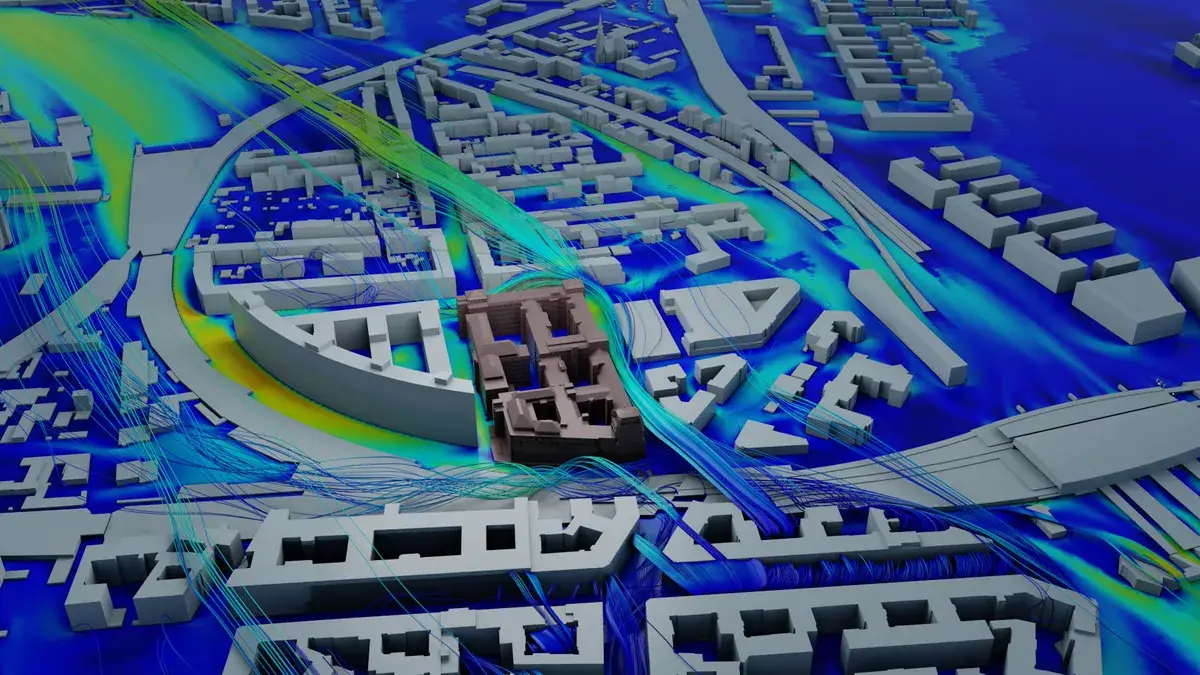
Fig. 1: Streamlines around the Berliner Bremsenwerk geometry.
The study had to answer a direct question: where will people experience uncomfortable or unsafe wind conditions?
Local effects can include:
- acceleration around building corners
- downward flow along a facade
- channelled flow through narrow passages
- recirculation in sheltered areas
A design team needs the frequency of these effects, not only their presence in one wind direction.
Step 1: Use local weather data
The study used the Berlin-Tempelhof weather station, 6.44 km from the site. Its long-term data showed that winds came mainly from the west to southwest. A second contribution came from the east.
The mean wind speed was 4.05 m/s at 10 m height. The west wind occurred most often, at 12.66%, with a speed of 4.31 m/s. The east wind occurred 10.89% of the time, with a speed of 3.40 m/s.
This data gives each simulated direction a real frequency and velocity. Without it, a comfort map cannot represent the conditions that people are likely to experience at the site.
Step 2: Simulate the relevant directions
The assessment used 16 wind directions. Each direction had its own inlet wind speed and frequency from the weather data.
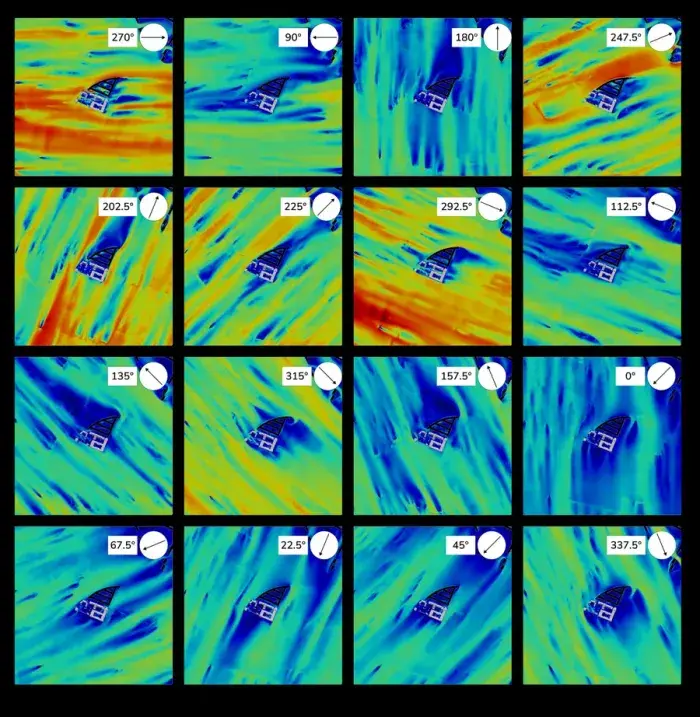
Fig. 2: CFD results for the 16 wind directions.
This matters because the same building responds differently when the inlet direction changes. A west wind can accelerate around one corner. An east wind can expose a different passage or courtyard.
The workflow must keep the main assumptions consistent across all cases:
- computational domain
- atmospheric boundary layer
- terrain roughness
- mesh refinement near buildings and pedestrian areas
- result extraction height
The Bremsenwerk results were evaluated at 2 m above ground.
Step 3: Convert flow fields into comfort maps
The study assessed the combined CFD and weather data with Lawson and NEN8100 criteria.
Lawson criteria group conditions by activities such as sitting, standing, strolling, and walking. NEN8100 uses a 5 m/s threshold and occurrence probabilities to classify comfort for different activities.
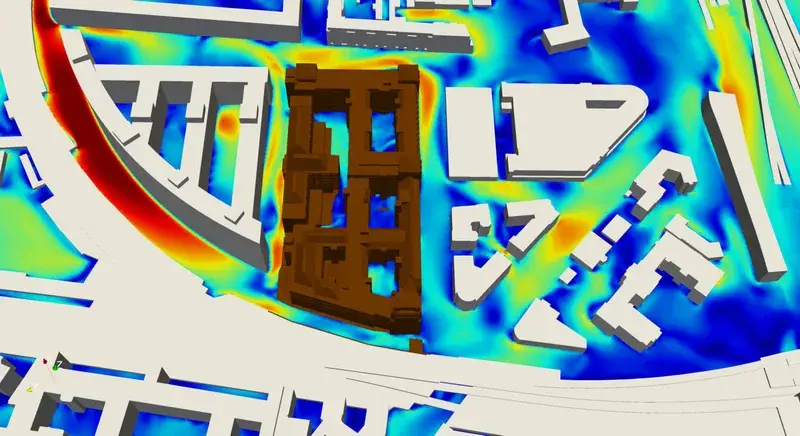
Fig. 3: Velocity field at pedestrian level.
Both methods gave similar results for this site. The report found no strict need for mitigation. It also identified the western to southwestern side as an area where extra trees or landscaping could improve comfort.
That is the useful output: a location-based comfort assessment that a design team can act on.
What the dicehub template makes repeatable
The Pedestrian Wind Comfort template organizes the repeated parts of the study:
- Upload and prepare the urban geometry.
- Select the site and weather data.
- Define the wind directions and their frequencies.
- Create the CFD domain, mesh, and boundary conditions.
- Run the cases in the cloud.
- Combine the results into pedestrian comfort maps.
The template does not remove engineering judgement. It keeps the setup consistent, so an engineer can focus on the geometry, assumptions, result quality, and design response.
This is useful during design iteration. If a facade changes, a passage opens, or a mitigation measure is added, the team can run the same workflow again and compare the results under the same assumptions.
Frequently asked questions
How many wind directions does a pedestrian wind study need?
The required number depends on the site and the project standard. The Bremsenwerk assessment used 16 directions at intervals of 22.5 degrees. This captured the main changes in direction while keeping the study practical.
Why is local weather data necessary?
CFD gives the flow response for an inlet condition. Weather data gives the speed and frequency of wind from each direction. A comfort assessment needs both types of data.
At what height are pedestrian wind results evaluated?
The Bremsenwerk study evaluated velocity at 2 m above ground. The applicable standard and project requirements must define the correct height for each new study.
Do high local velocities always require mitigation?
No. Comfort depends on velocity, frequency, location, and intended pedestrian activity. The Bremsenwerk CFD results had local acceleration zones, but the combined Lawson and NEN8100 assessments found no strict need for mitigation.
Read the Pedestrian Wind Comfort solution page to see the workflow, images, and published reports.